This article explores the implementation of fuzzy logic in R, covering user-defined functions and built-in packages. From basic concepts to advanced applications, readers will learn to apply fuzzy logic techniques for enhanced decision-making in diverse fields.
The Tipping Problem
The Tipping Problem serves as a classic demonstration of fuzzy logic’s ability to distill complex decision-making into a set of intuitive rules. In this scenario, we aim to develop a fuzzy logic system that predicts the appropriate tip percentage at a restaurant based on service quality and food rating, both rated on a scale of 0 to 10. The output, tipping percentage, ranges from 0% to 25%.
We define three linguistic variables: service (with categories poor, good, excellent), food quality (with categories bad, decent, great), and tip (with categories low, medium, high).
Three expert rules guide our fuzzy logic system:
IF service is excellent OR food quality is great, THEN tip is high.
IF service was good, THEN tip is medium.
IF service was poor AND food quality was bad, THEN tip is low.
These rules provide a simple yet effective framework for translating qualitative assessments of service and food quality into a quantitative tipping recommendation, showcasing the power of fuzzy logic in modeling real-world decision-making processes.
To implement the Fuzzy Logic System (FLS) from scratch, we need to follow several steps:
Define linguistic variables: Define the linguistic variables for service, food quality, and tip, along with their respective membership functions.
Define fuzzy rules: Encode the expert rules into fuzzy IF-THEN statements.
Fuzzification: Convert crisp input values (service quality and food rating) into fuzzy sets using the defined membership functions.
Apply fuzzy rules: Use the fuzzy IF-THEN statements to determine the degree of membership for each output fuzzy set.
Aggregation: Combine the outputs from different rules to determine the overall fuzzy output.
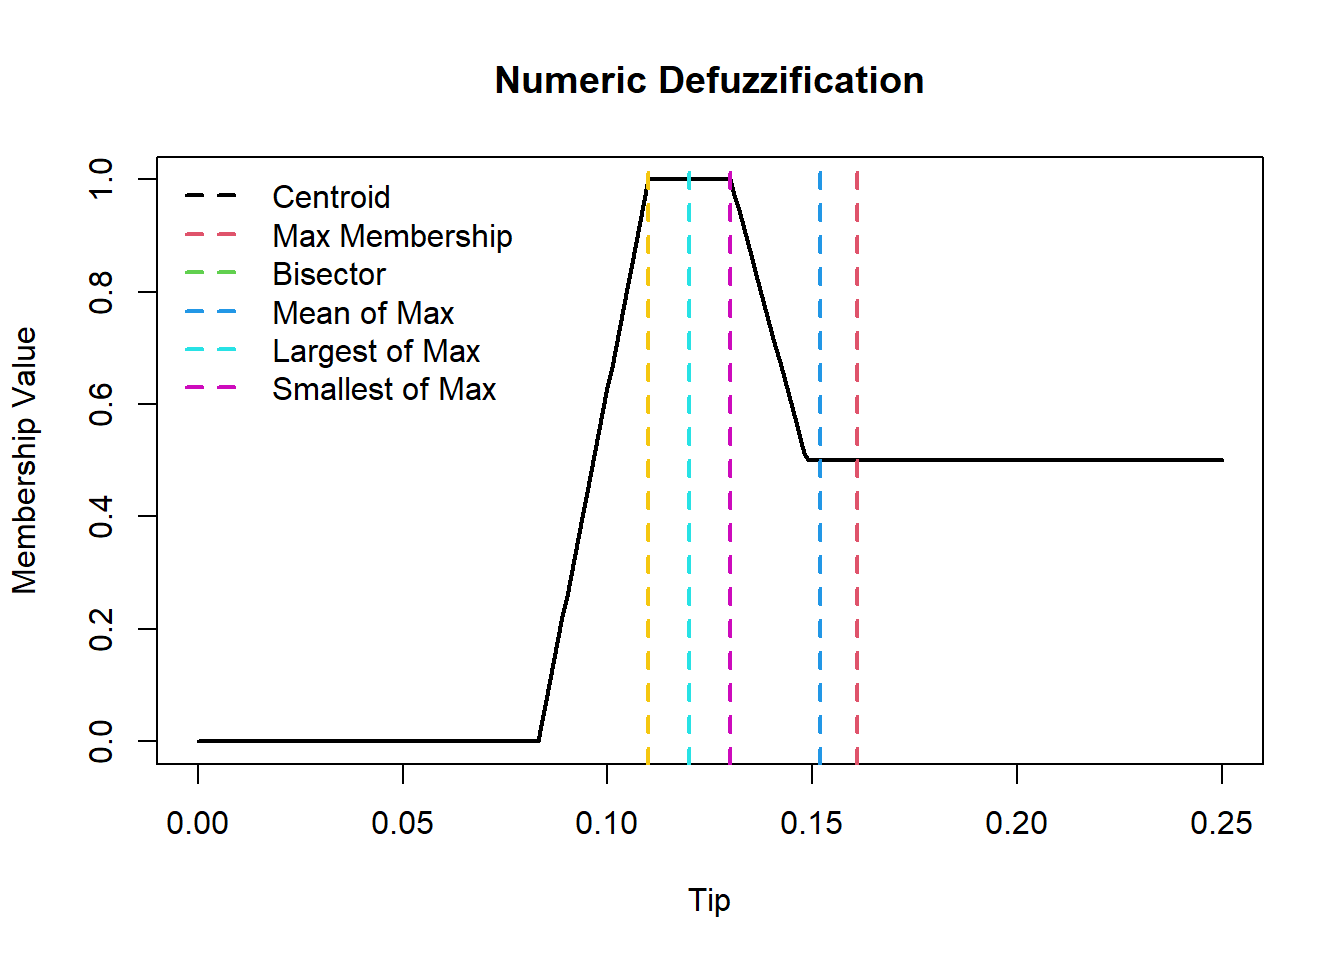
Defuzzification: Convert the aggregated fuzzy output back into a crisp value (tip percentage).
We’ll proceed with these steps using R programming to illustrate the implementation of the FLS from scratch. Let’s begin by defining the linguistic variables and their membership functions.
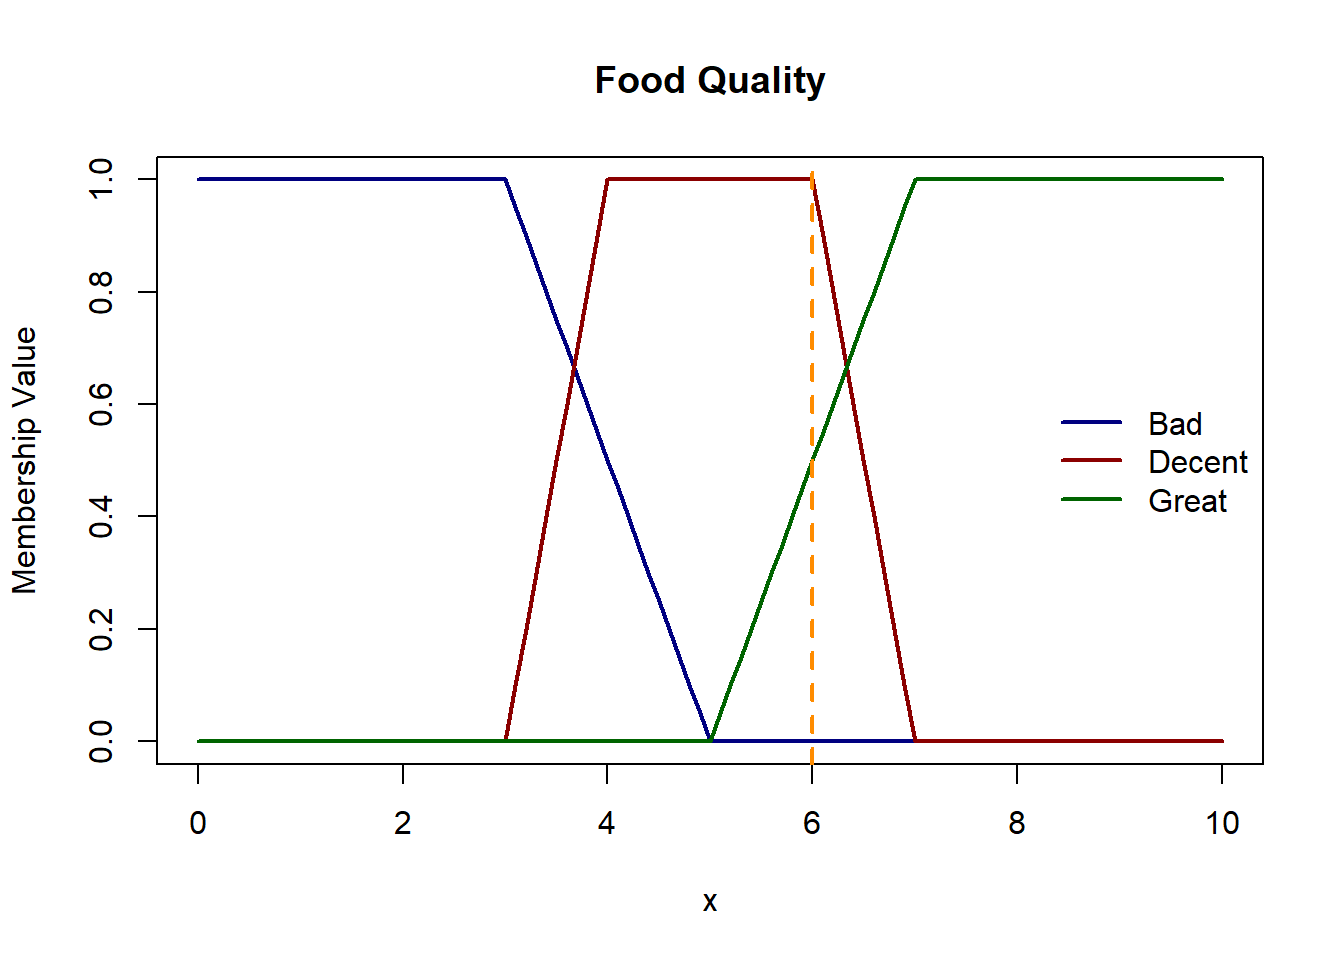
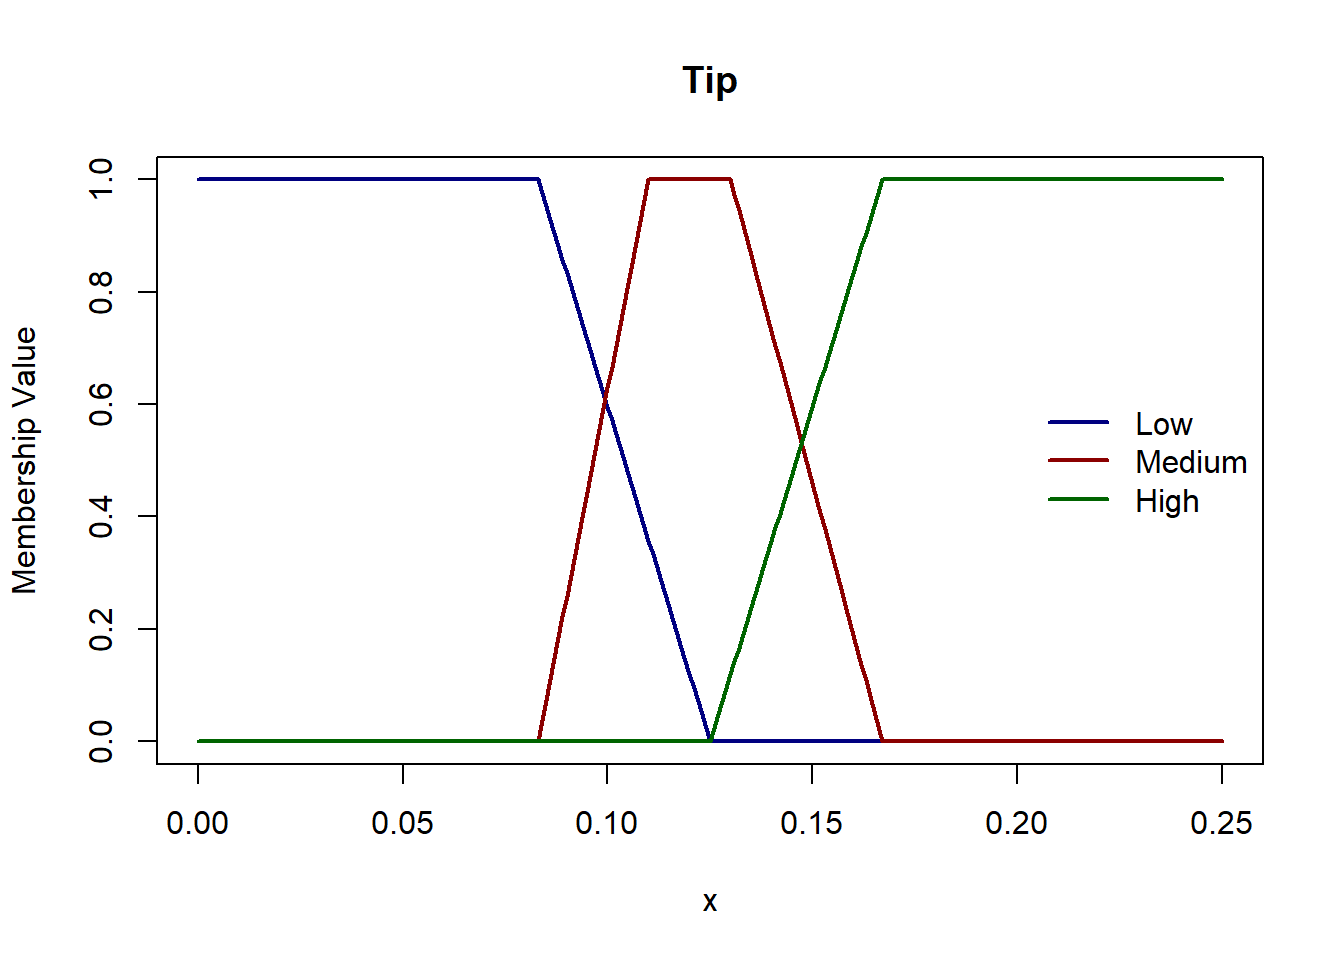
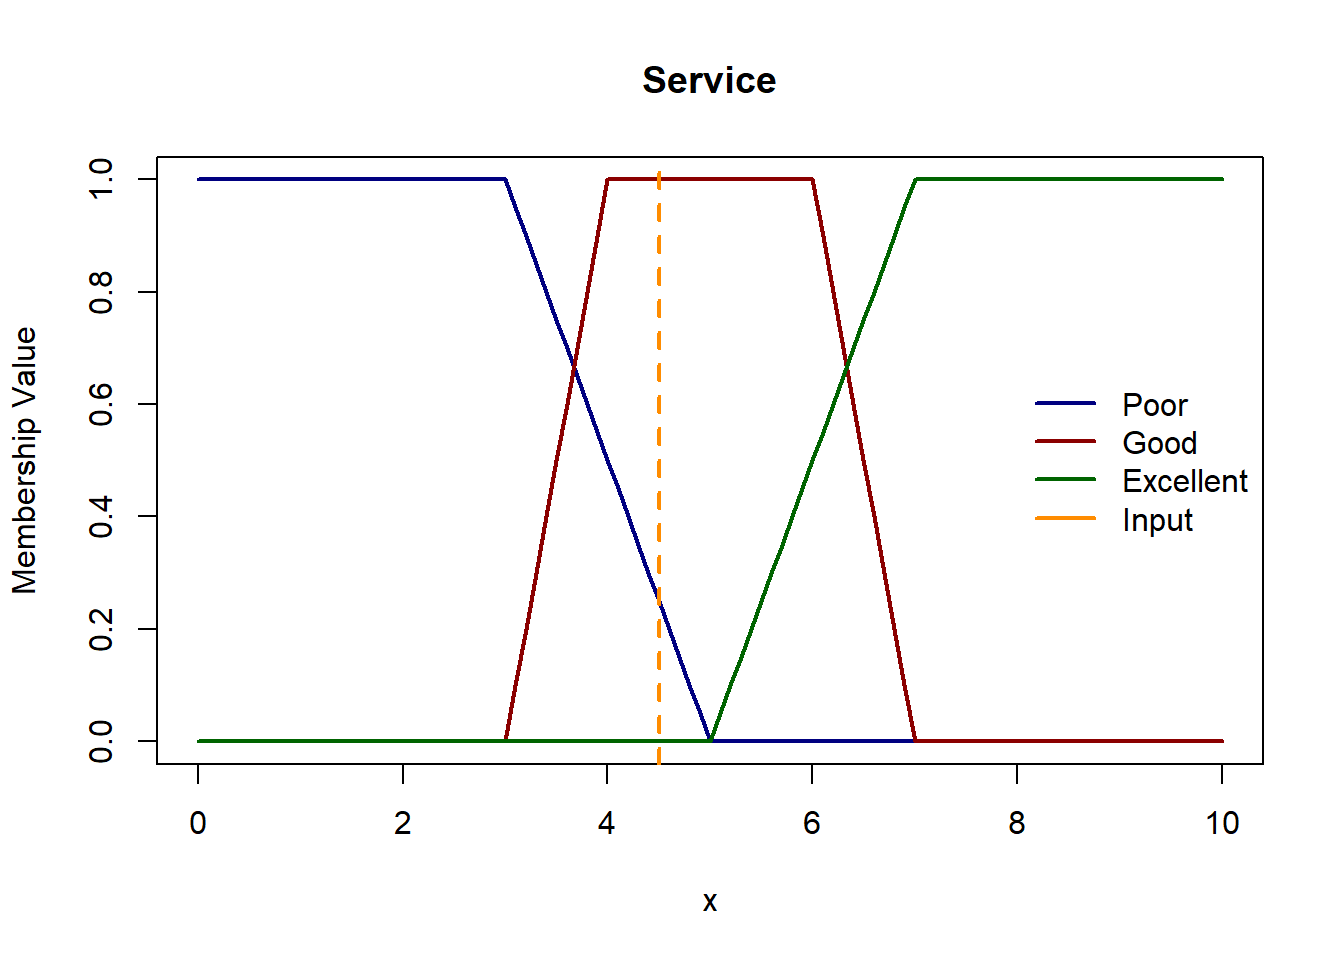
Let’s start constructing our membership functions. We define trapezoid membership functions for all both the inputs and output. Since the domain of service and food quality is the same, let’s keep their membership functions the same as well. The trapezoids are left- and right-open for 1st and 3rd linguistic variables for e.g. for service, ‘poor’ and ‘great’ have left- and right-open trapezoids respectively.
Let’s consider a scenario where we have service rating of 4.5 and food quality 6. Here we will treat this input as a fuzzy singleton.
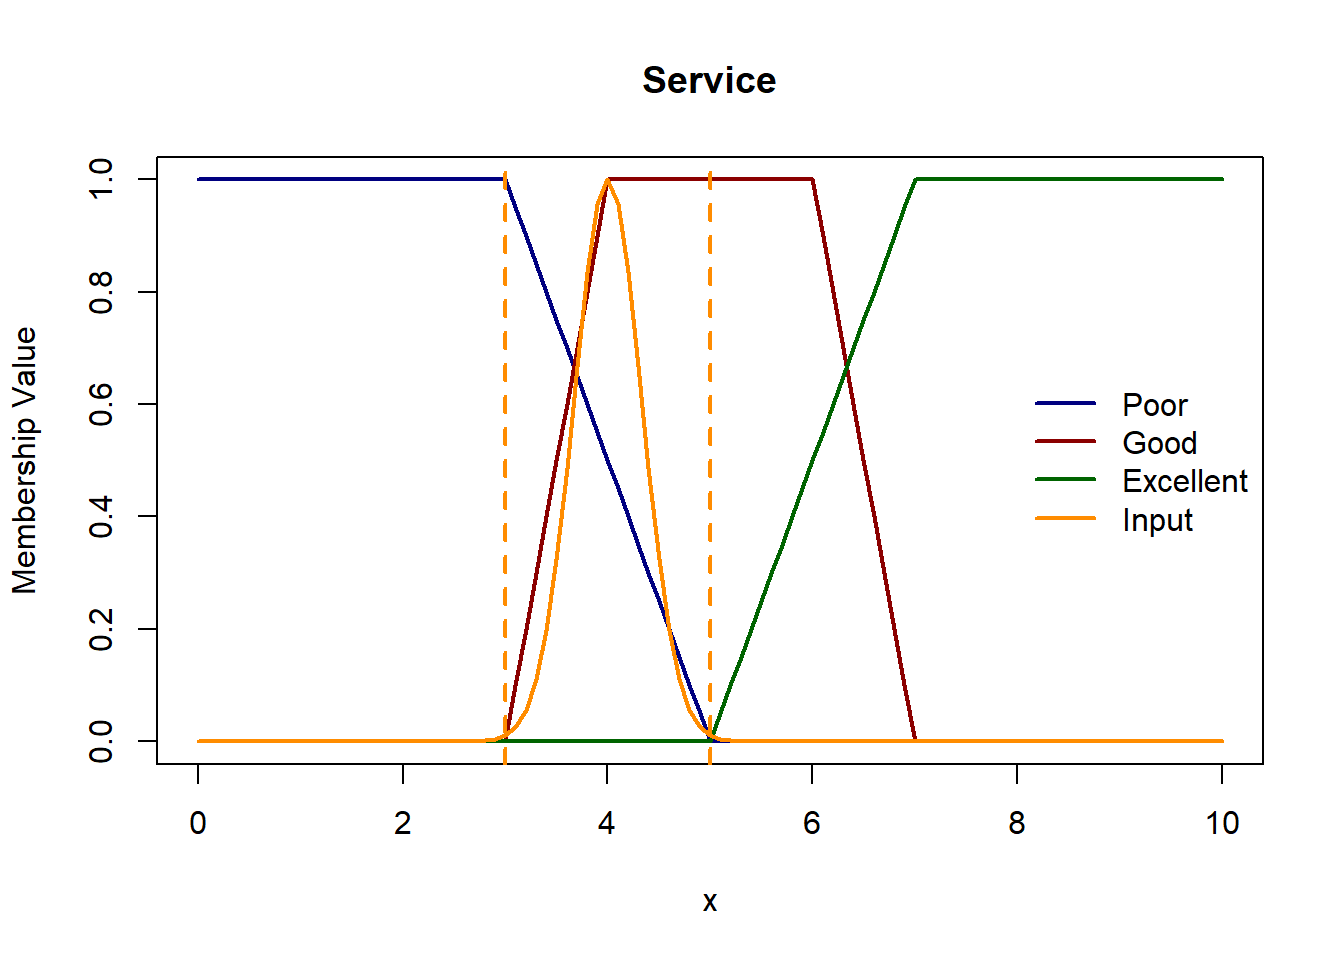
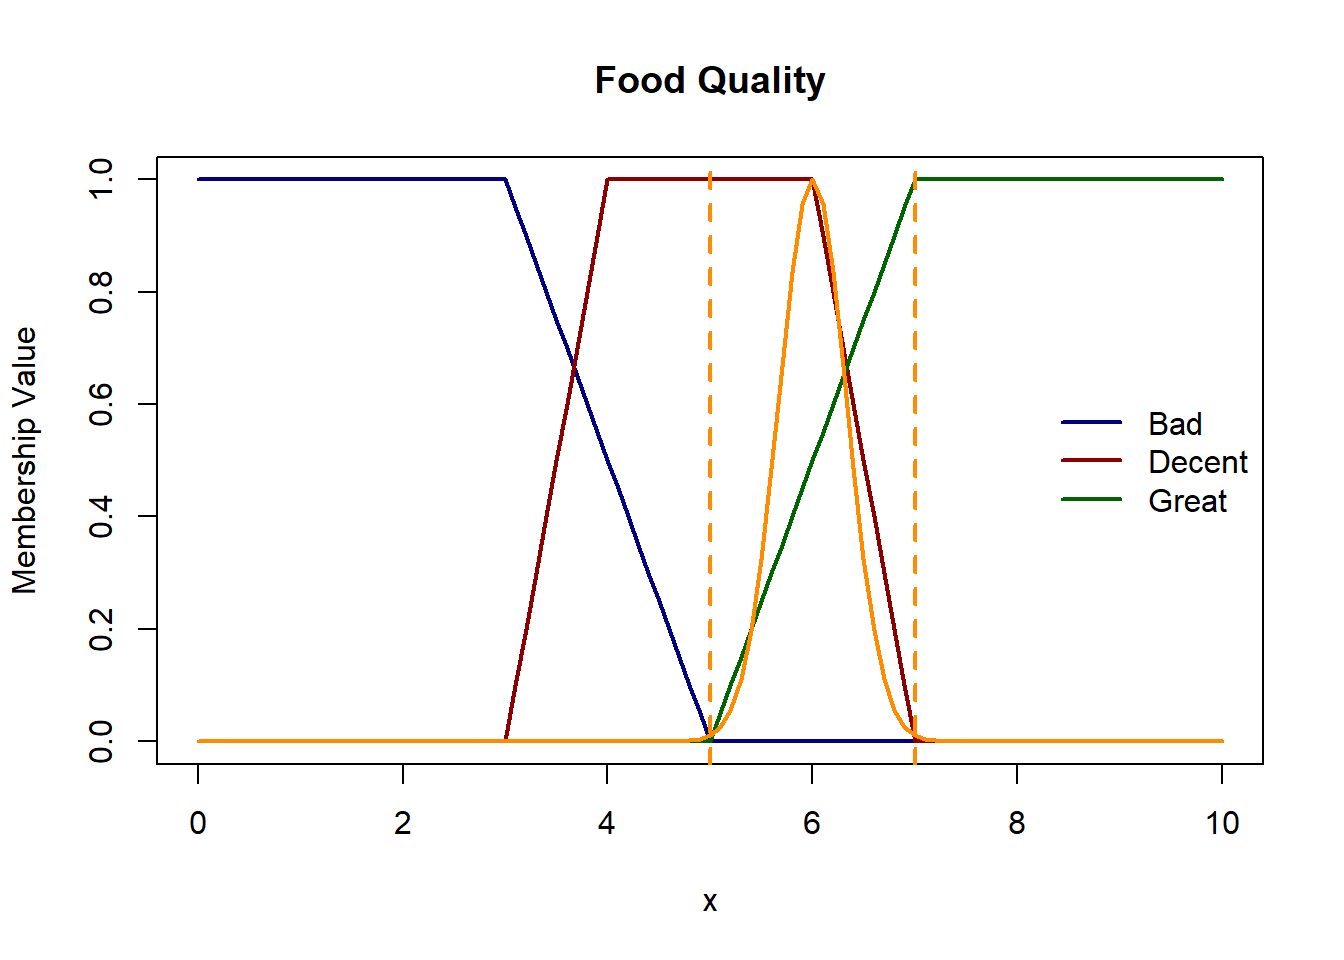
Let’s plot these functions & see where the inputs belong.
Membership values for service rating of 4.5 in Poor: 0.25, in Good: 1 and in Excellent: 0 Membership values for food quality of 6.0 in Bad 0, in Decent 1 and in Great 0.5
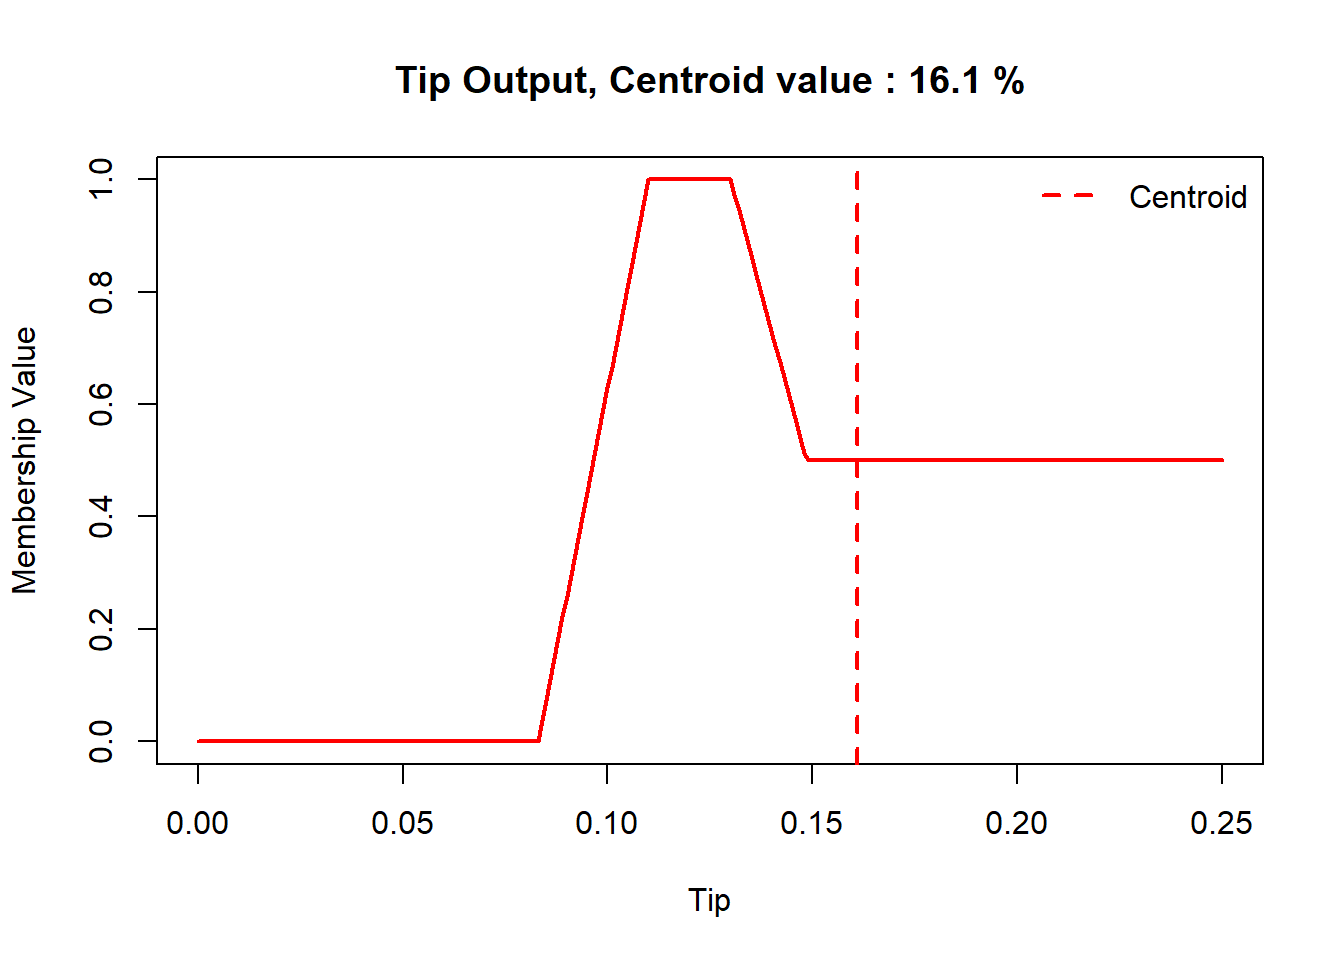
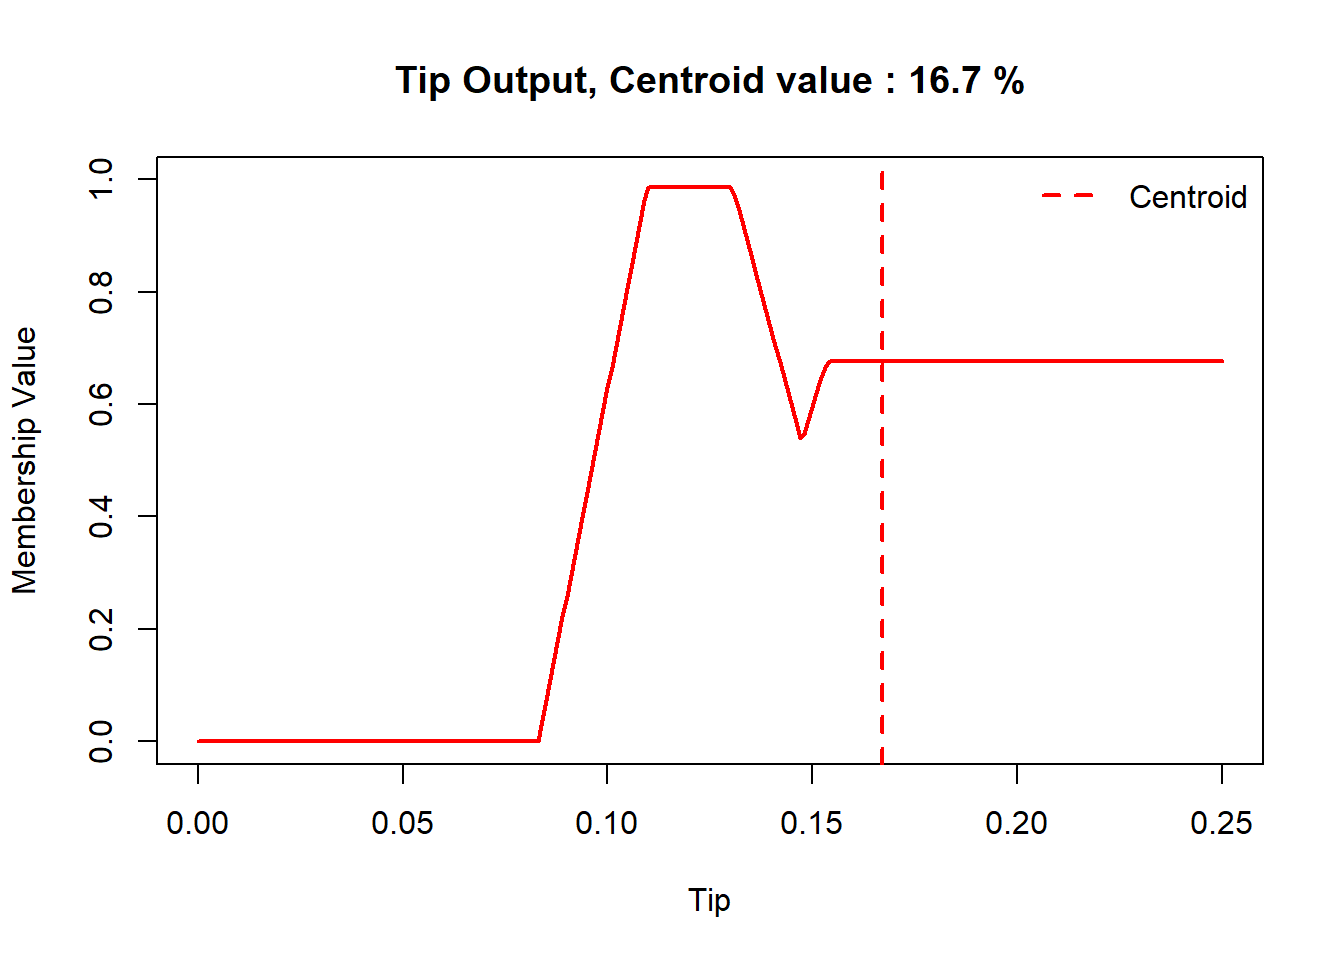
Here, we will see the rules firing and evaluate the output fuzzy set under the Mamdani Model.
Code
w1 =max(service.ex(service_input), food.great(food_input))w2 =service.good(service_input)w3 =min(service.poor(service_input), food.bad(food_input))cat('Firing strength of Rule 1 =',w1,', of Rule 2 =',w2,'and of Rule 3 =',w3)
Firing strength of Rule 1 = 0.5 , of Rule 2 = 1 and of Rule 3 = 0
The FuzzyR package was produced by the Intelligent Modelling and Analysis Group and Lab for Uncertainty in Data and decision making (LUCID), University of Nottingham. Here is the link to IEEE Xplore website and the R Documentation & Github for the package.
Let’s introduce some of the key functions and how they work:
First, we initialise our Fuzzy Inference System (FIS) by using newfis() command. Here, we can specify the name of our inference system, model type, and/or methods, aggregate and defuzzification methods.
Next to define our input and output linguistic variables, we use addvar() command. Here, we mention our fis object, specify if this is an input or output linguistic variable, give an index, name and define the membership function for it.
varIndex = 1 implies that this is the first input/output variable.
mfType = ‘gaussmf’ for Gaussian, ‘trapmf’ for trapezoid, ‘trimf’ for triangular, ‘gbellmf’ for generalized bell function, ‘linearmf’ for linear function.
mfParamas = c(2,3) for example are Gaussian parameters where sigma = 2 and mu = 3. Similarly, we can provide other parameter values of membership functions.
Next we define our fuzzy rules. For this use rbind() to row-wise combine the rule structures for each rule. Then we specify this in addrule() command. The rules can be printed using showrule() command.
Let’s understand the rule structure : c(1st Input’s Linguistic Variable’s index, 2nd Input’s Linguistic Variable’s index, 1st Output’s Linguistic Variable’s index, Fuzzy Operator for Consequents, Fuzzy Operator for Antecedents)
The first fuzzy rule : IF Service is Excellent OR Food is Great, Then Tip is High >>> is formulated as c(3, 3, 3, 1, 2) because Excellent is 3rd variables for service, Great is 3rd variable for food and High is 3rd variable for Tip. Then, ‘1’ implies that consequents are combined using AND operator to produce the final fuzzy output. Then, ‘2’ implies that antecedents are combined using OR operator.
The default andMethod = “min”, orMethod = “max” under newfis() command.
To see the entire structure of our Fuzzy Inference System we can use the showfis() command.
To evaluate the output for a given set of input values, we can use the evalfis() command.
Lastly, we can produce some plots
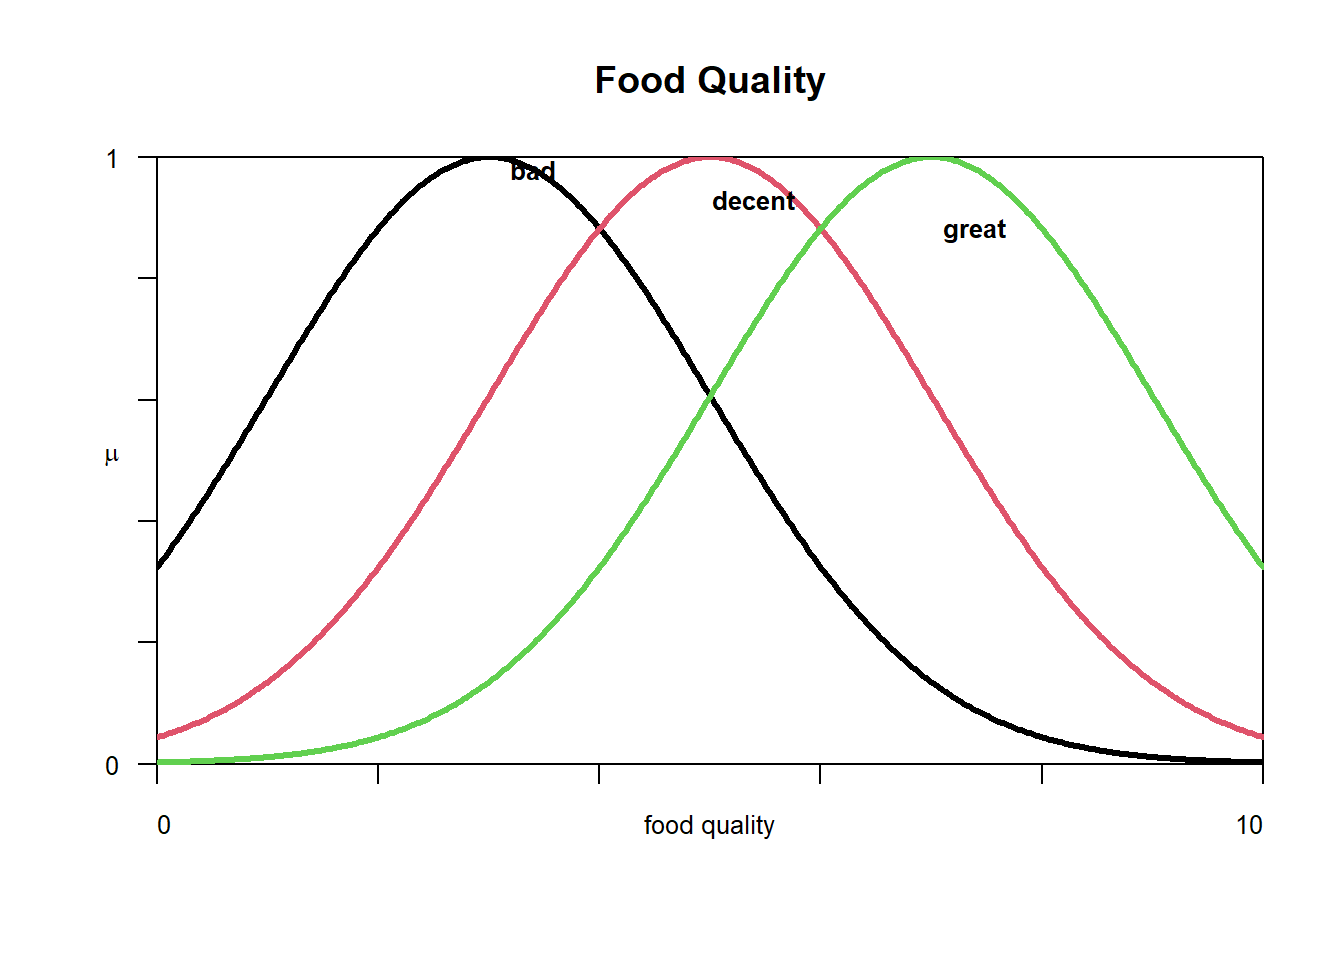
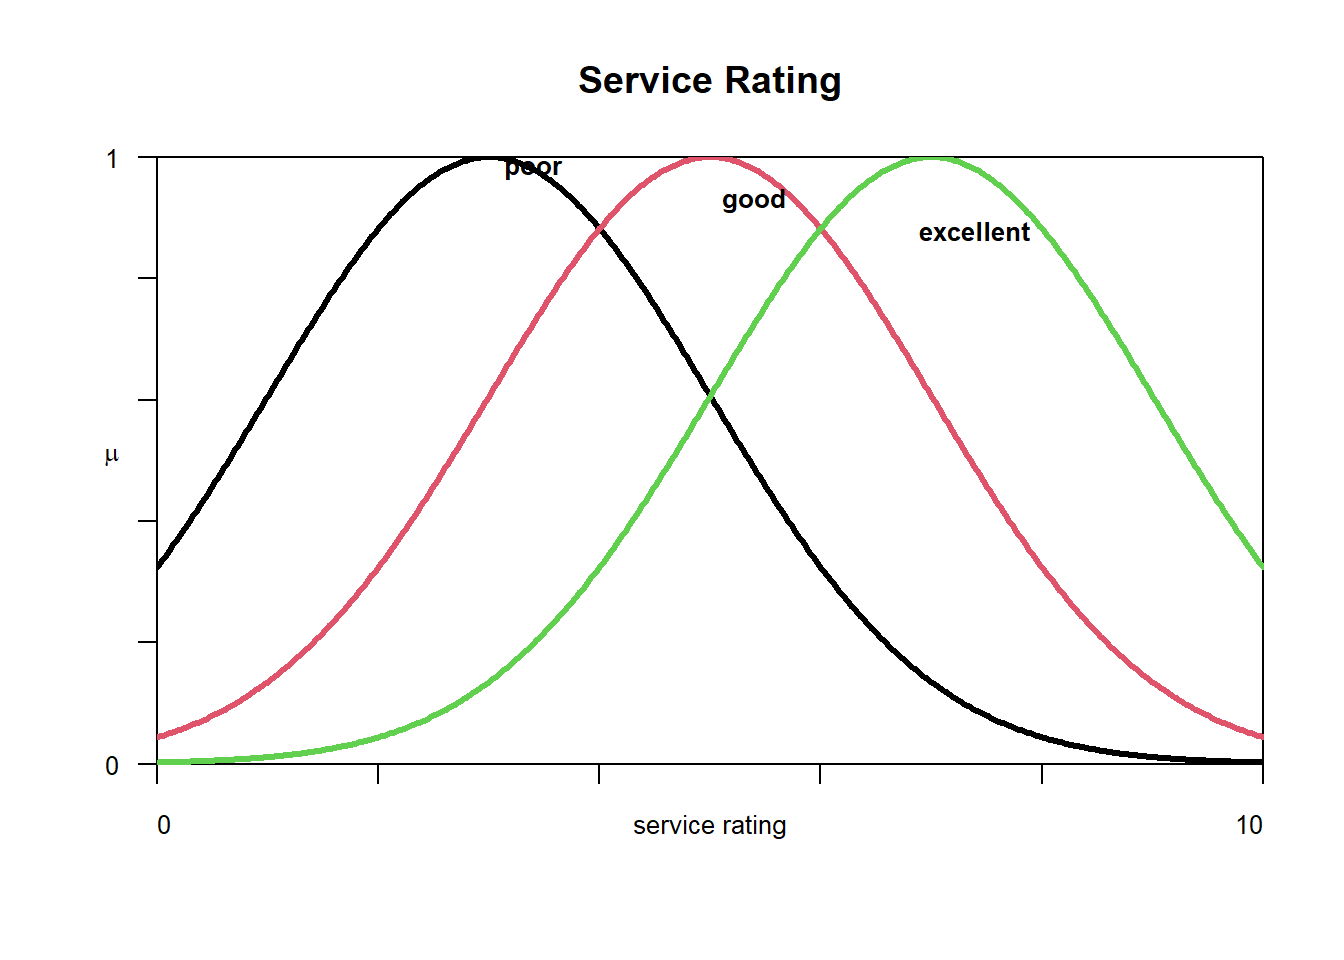
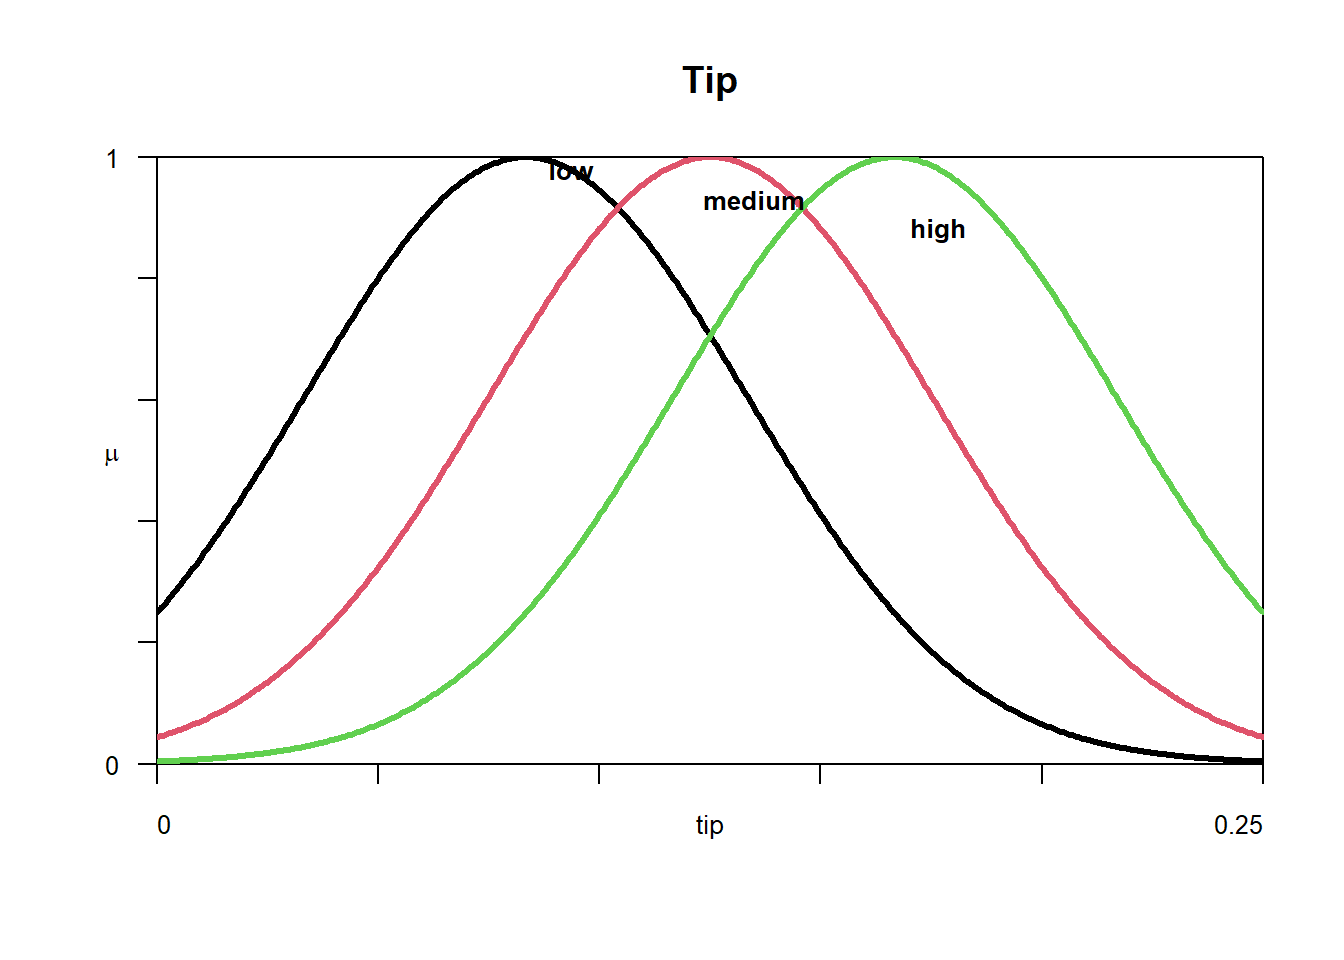
Membership functions can be plotted using plotmf() command by specifying our fis, variable index, variable type and labels.
We can generate a Surface Plot using gensurf() command.
Here, modification is made using Plotly package, to provide an interactive 3D Surface Plots.
Code
library(FuzzyR)# initialise a fuzzy inference system (fis)fis =newfis('Tipper')# define inputsfis =addvar(fis, 'input', 'food quality', c(0,10))fis =addvar(fis, 'input', 'service rating', c(0,10))# define outputfis =addvar(fis, 'output', 'tip', c(0,0.25))# define membership functions# for food qualityfis =addmf(fis, 'input', varIndex =1, 'bad', mfType ='gaussmf', mfParams =c(2, 3))fis =addmf(fis, 'input', varIndex =1, 'decent', mfType ='gaussmf', mfParams =c(2, 5))fis =addmf(fis, 'input', varIndex =1, 'great', mfType ='gaussmf', mfParams =c(2, 7))# for service ratingfis =addmf(fis, 'input', varIndex =2, 'poor', mfType ='gaussmf', mfParams =c(2, 3))fis =addmf(fis, 'input', varIndex =2, 'good', mfType ='gaussmf', mfParams =c(2, 5))fis =addmf(fis, 'input', varIndex =2, 'excellent', mfType ='gaussmf', mfParams =c(2, 7))# for tip fis =addmf(fis, 'output', varIndex =1, 'low', mfType ='gaussmf', mfParams =c(0.05, 0.0833))fis =addmf(fis, 'output', varIndex =1, 'medium', mfType ='gaussmf', mfParams =c(0.05, 0.125))fis =addmf(fis, 'output', varIndex =1, 'high', mfType ='gaussmf', mfParams =c(0.05, 0.1667))# define fuzzy rules# if excellent service OR great food, then tip High# if good service, then tip Medium# if poor service AND bad food, then tip Lowrules =rbind(c(3,3,3,1,2), c(0,2,2,1,0), c(1,1,1,1,1))fis =addrule(fis, rules)# fuzzy rules using linguistic variablesshowrule(fis)
If (food quality is great) or (service rating is excellent) then (tip is high) (1)
If (service rating is good) then (tip is medium) (1)
If (food quality is bad) and (service rating is poor) then (tip is low) (1)
Code
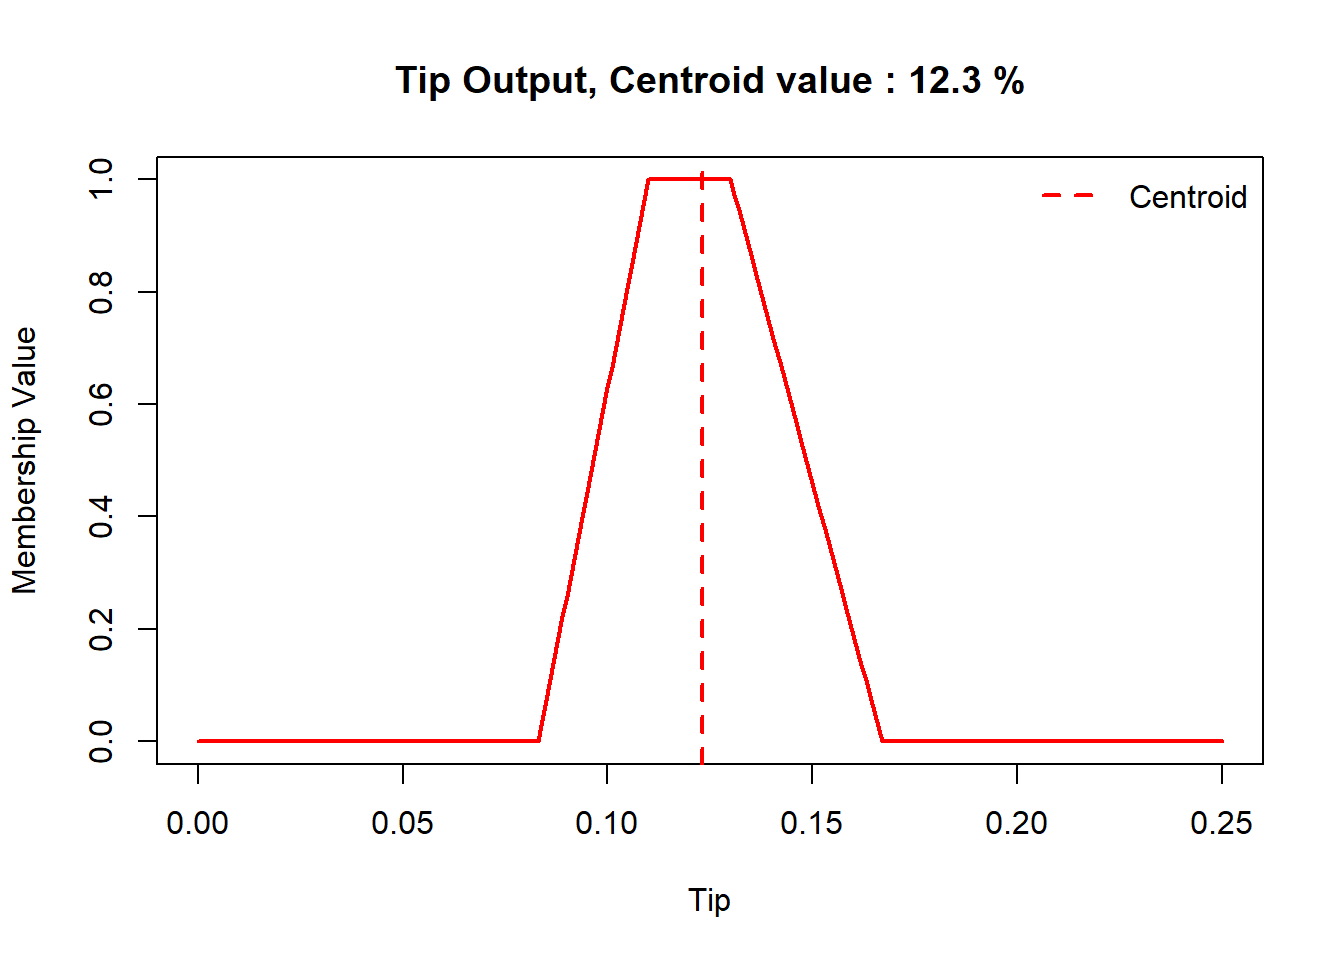
# outline of the fuzzy inference system# showfis(fis)# evaluateresult =evalfis(c(food_input,service_input), fis)cat('Tip =', round(result*100,2),'%')
Tip = 14.2 %
Code
# plot membership functions# plotmf(fis, varType = 'input',varIndex = 1,main = 'Food Quality')# plotmf(fis, varType = 'input',varIndex = 2,main = 'Service Rating')# plotmf(fis, varType = 'output',varIndex = 1,main = 'Tip')# generate surface area plot# gensurf(fis)library(plotly)gensurf_plotly =function(fis,ix1 =1,ix2 =2,ox1 =1){ i1 = fis$input[[ix1]] i2 = fis$input[[ix2]] o1 = fis$output[[ox1]] x =seq(i1$range[1], i1$range[2], length =30) y =seq(i2$range[1], i2$range[2], length =30) m =as.matrix(expand.grid(x, y)) o =evalfis(m, fis) z =matrix(o[, ox1], 30, 30, byrow = F)plot_ly(x =~x, y =~y, z =~z, type ="surface") %>%layout(scene =list(xaxis =list(title = i1$name),yaxis =list(title = i2$name),zaxis =list(title = o1$name)))}gensurf_plotly(fis)
In order to implement Larsen Model, we need to specify andMethod and orMethod as ‘prod’ for product. This ensures that the antecedents are combined correctly per the Larsen Model.
For implementing the TSK model, we need to make the following changes:
We specify fisType = ‘tsk’ in newfis() command to specify that we are creating a TSK model.
We mention ‘singleton.fuzzification’ to ensure that the inputs are dealt as fuzzy singleton.
Lastly, we change the output membership functions to ‘linearmf’ and specify the values of the linear relationship. For example, c(10, 0.5, 0.5) implies, tip = 10 + 0.5*food + 0.5*service for medium tip.
Code
fis =newfis('tipper', fisType ='tsk')fis =addvar(fis, 'input', 'service', c(0, 10), 'singleton.fuzzification')fis =addvar(fis, 'input', 'food', c(0, 10), 'singleton.fuzzification')fis =addvar(fis, 'output', 'tip', c(0, 0.25))# define membership functions# for food qualityfis =addmf(fis, 'input', varIndex =1, 'bad', mfType ='gaussmf', mfParams =c(2, 3))fis =addmf(fis, 'input', varIndex =1, 'decent', mfType ='gaussmf', mfParams =c(2, 5))fis =addmf(fis, 'input', varIndex =1, 'great', mfType ='gaussmf', mfParams =c(2, 7))# for service rating fis =addmf(fis, 'input', varIndex =2, 'poor', mfType ='gaussmf', mfParams =c(2, 3))fis =addmf(fis, 'input', varIndex =2, 'good', mfType ='gaussmf', mfParams =c(2, 5))fis =addmf(fis, 'input', varIndex =2, 'excellent', mfType ='gaussmf', mfParams =c(2, 7))# for tip fis =addmf(fis, 'output', 1, 'low', 'linearmf', c(0, 0.5, 0.5))fis =addmf(fis, 'output', 1, 'medium', 'linearmf', c(10, 0.5, 0.5))fis =addmf(fis, 'output', 1, 'high', 'linearmf', c(20, 0.5, 0.5))# define fuzzy rules# if excellent service OR great food, then tip = 20 + 0.5*food + 0.5*service# if good service, then tip = 10 + 0.5*food + 0.5*service# if poor service AND bad food, then tip = 0.5*food + 0.5*servicerules =rbind(c(3,3,3,1,2), c(0,2,2,1,1), c(1,1,1,1,1))fis =addrule(fis, rules)# fuzzy rules using linguistic variablesshowrule(fis)
If (service is great) or (food is excellent) then (tip is high) (1)
If (food is good) then (tip is medium) (1)
If (service is bad) and (food is poor) then (tip is low) (1)
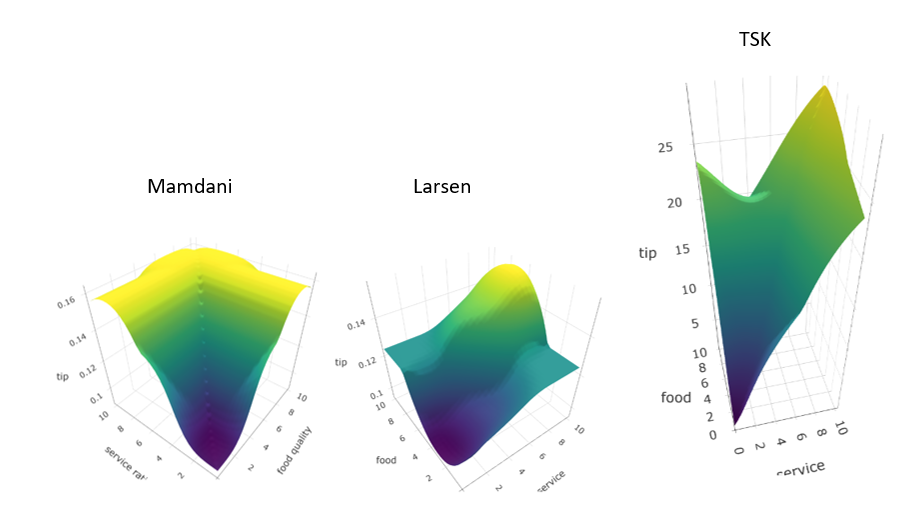
Surface plots are a way to visualise 3-dimensional data where x- and y-axis represent the inputs service rating and food quality and z-axis represents the tip output. To read the plots, we look at the color scale (to understand the intensity of output), contours and gradients (to see how rapidly the output changes with respect to inputs), peaks and valleys (to see strong rules and interactions between input variables).
The Mamdani Surface plot is relatively smooth but with distinct plateaus, which is typical for Mamdani models. These plateaus suggests that there are areas where the output remains constant over a range of input values, indicative of the max-min inference and centroid defuzzification.
The Larsen Surface plot is smoother compared to Mamdani, which is characteristic of the Larsen Model as it uses product operation in rules’ implication, leading to a more graded and less terraced effect. This suggests a more proportional relationship between the inputs and the output, rather than a more rigid categorization seen in the Mamdani model.
The first-order TSK Surface plot shows a very linear relationship which is characteristic of the first-order TSK model. The linearity in the surface indicates a direct and proportional influence of input changes on the output, with potentially less interpretability but more precision and analytical tractability.
Each model’s behavior is largely determined by how the rules are applied and how the outputs are generated from the inputs. The Mamdani and Larsen models are more interpretative with gradual transitions, while the TSK model is more mathematical and precise.
Subsethood & Interval Data
Up to this point, we’ve approached fuzzification by treating the inputs as fuzzy singletons. Now let’s explore other ways of fuzzifying them & introduce interval inputs to enrich our analysis. For instance, lets define service rating as an interval from 3 to 5 and food quality rating from 5 to 7.
This article is part of a comprehensive series on Fuzzy Logic and Systems using R, laying the groundwork for understanding advanced concepts and applications in this field.
For further exploration, you can access other articles in this series:
The work in this article is inspired by the teachings of my Professors at the University of Nottingham. Their guidance and expertise have greatly influenced the content and direction of these articles. For further insights into their research and contributions, you can visit their University of Nottingham profiles:
These articles aim to delve deeper into Fuzzy Logic concepts and their practical implementations, building upon the foundation laid by our esteemed professors. Stay tuned for more valuable insights and applications in this exciting field.
 Membership values for food quality of 6.0 in Bad 0, in Decent 1 and in Great 0.5